


Sobel 算子是一种常用的图像处理工具,它描述了图像中每个像素点处的亮度或颜色值变化方向和强度。它通常用于分析图像的边缘、纹理、形状和其他特征。
在二维图像中,梯度通常是两个分量的矢量,分别表示在水平和垂直方向上的变化率,这两个分量通常被称为 x 梯度和 y 梯度。
1. 图像的梯度
计算图像的梯度,可以使用 opencv 中的 Sobel 函数来完成,其函数声明如下:
cv2.Sobel(src, ddepth, dx, dy, dst, ksize, scale, delta, borderType)
src:输入图像,通常是单通道的灰度图像dddepth:表示结果图像的数据类型,它可以取以下值之一:cv2.CV_8U:8位无符号整数cv2.CV_16U:16位无符号整数cv2.CV_32F:32位浮点数cv2.CV_64F:64位浮点数
dx:x方向上的导数阶数,通常为0、1或2dy:y方向上的导数阶数,通常为0、1或2dst:存储运算的结果,如果未提供此参数,将创建一个与输入图像相同大小和深度的新图来存储结果ksize:Sobel核的大小,它通常是一个奇数值,例如3、5或7,较大的内核将导致更强烈的平滑效果scale:可选的比例因子,用于调整结果图像的强度。默认值为1delta:可选的偏移值,它将添加到结果中,默认值为0borderType:这是用于处理边界的可选参数,通常情况下可以采用默认值cv2.BORDER_DEFAULT

import cv2
import matplotlib.pyplot as plt
import numpy as np
import warnings
warnings.filterwarnings('ignore')


# 显示图像
def show_image(image, title, index):
    plt.subplot(3, 2, index)
    plt.imshow(image, cmap='gray')
    plt.title(title)
    plt.axis('off')


# 计算图像梯度
def calculate_gradient(image, kszie):
    gradient_x = cv2.Sobel(image, ddepth=cv2.CV_8U, dx=1, dy=0, ksize=kszie)
    gradient_y = cv2.Sobel(image, ddepth=cv2.CV_8U, dx=0, dy=1, ksize=kszie)
    return gradient_x, gradient_y


def test():

    image = cv2.imread('demo.png')
    image = cv2.cvtColor(image, cv2.COLOR_BGR2GRAY)

    gx, gy = calculate_gradient(image, kszie=1)
    show_image(gx, 'x kszie=1', 1)
    show_image(gy, 'y kszie=1', 2)

    gx, gy = calculate_gradient(image, kszie=3)
    show_image(gx, 'x kszie=3', 3)
    show_image(gy, 'y kszie=3', 4)

    gx, gy = calculate_gradient(image, kszie=5)
    show_image(gx, 'x kszie=5', 5)
    show_image(gy, 'y kszie=5', 6)

    plt.show()

if __name__ == '__main__':
    test()


梯度的计算就是使用表示不同方向的 filter 对原始图像进行卷积计算,如下代码示例:
import cv2
import matplotlib.pyplot as plt
import numpy as np
import warnings
warnings.filterwarnings('ignore')
# 1x1 滤波器
sobel_x_1 = np.array([[-1, 0, 1]], dtype=float)
sobel_y_1 = np.array([[-1],
[0],
[1]], dtype=float)
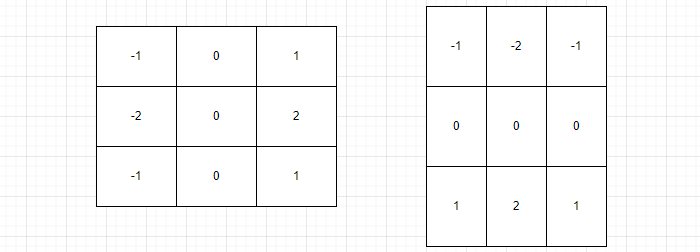
# 3x3 滤波器
sobel_x_3 = np.array([[-1, 0, 1],
[-2, 0, 2],
[-1, 0, 1]], dtype=float)
sobel_y_3 = np.array([[-1, -2, -1],
[ 0, 0, 0],
[ 1, 2, 1]], dtype=float)
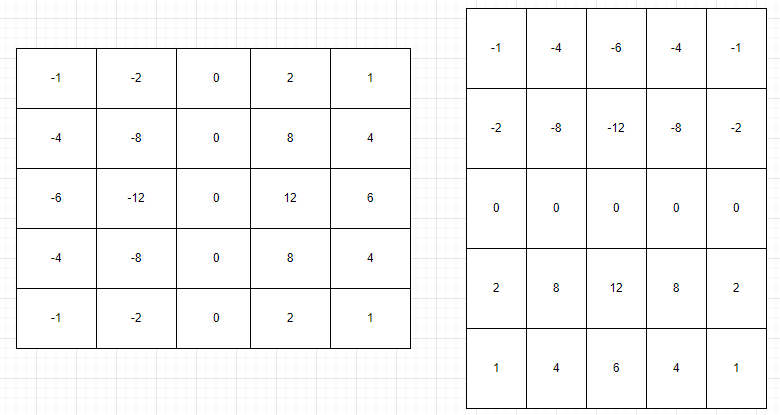
# 5x5 滤波器
sobel_x_5 = np.array([[-1, -2, 0, 2, 1],
[-4, -8, 0, 8, 4],
[-6, -12, 0, 12, 6],
[-4, -8, 0, 8, 4],
[-1, -2, 0, 2, 1]], dtype=np.float32)
sobel_y_5 = np.array([[-1, -4, -6, -4, -1],
[-2, -8, -12, -8, -2],
[0, 0, 0, 0, 0],
[2, 8, 12, 8, 2],
[1, 4, 6, 4, 1]], dtype=np.float32)
# 显示图像
def show_image(image, title, index):
plt.subplot(3, 2, index)
plt.imshow(image, cmap='gray', vmin=0, vmax=255)
plt.title(title)
plt.axis('off')
# 计算图像梯度
def calculate_gradient(image, sobel_x, sobel_y):
gradient_x = cv2.filter2D(image, ddepth=cv2.CV_8U, kernel=sobel_x, borderType=cv2.BORDER_DEFAULT)
gradient_y = cv2.filter2D(image, ddepth=cv2.CV_8U, kernel=sobel_y, borderType=cv2.BORDER_DEFAULT)
return gradient_x, gradient_y
def test():
image = cv2.imread('demo.png')
image = cv2.cvtColor(image, cv2.COLOR_BGR2GRAY)
gx, gy = calculate_gradient(image, sobel_x_1, sobel_y_1)
show_image(gx, 'x kszie=1', 1)
show_image(gy, 'y kszie=1', 2)
gx, gy = calculate_gradient(image, sobel_x_3, sobel_y_3)
show_image(gx, 'x kszie=3', 3)
show_image(gy, 'y kszie=3', 4)
gx, gy = calculate_gradient(image, sobel_x_5, sobel_y_5)
show_image(gx, 'x kszie=5', 5)
show_image(gy, 'y kszie=5', 6)
plt.show()
if __name__ == '__main__':
test()
默认使用 borderType=cv2.BORDER_DEFAULT,则先 pad 周边像素,如下图所示:

然后,计算每个像素经过卷积后的值,得到 x 和 y 方向的图像梯度矩阵:

2. 方向和幅值
- 梯度幅度:理解为图像边缘的强度,梯度的模长(或者说梯度的幅值)越大,说明此处图像变化的程度越大,也就越有可能是图像的边缘
- 梯度方向:两个方向梯度的夹角,可以理解为明亮变化的主要方向

- G 表示梯度幅值
- θ 表示梯度方向
import cv2
import matplotlib.pyplot as plt
import numpy as np
import warnings
warnings.filterwarnings('ignore')


def show_image(image, title, index):
    plt.subplot(1, 2, index)
    plt.imshow(image, cmap='gray', vmin=0, vmax=255)
    plt.title(title)
    plt.axis('off')


def test():

    image = cv2.imread('demo.png')
    image = cv2.cvtColor(image, cv2.COLOR_BGR2GRAY)

    gx = cv2.Sobel(image, cv2.CV_32F, 1, 0, ksize=3)
    gy = cv2.Sobel(image, cv2.CV_32F, 0, 1, ksize=3)

    # 1. 方法1
    # 计算幅度和方向,angleInDegrees 为 True 将会返回角度,否则返回弧度
    magnitude, direction = cv2.cartToPolar(gx, gy, angleInDegrees=True)

    # 2. 方法2
    magnitude = np.sqrt(gx ** 2 + gy ** 2)
    direction = np.arctan2(gy, gx)
    # 转换为角度
    direction = (np.degrees(direction) + 360) % 360

    show_image(direction, 'direction', 1)
    show_image(magnitude, 'magnitude', 2)
    plt.show()


if __name__ == '__main__':
    test()

 冀公网安备13050302001966号